10.12.2015
Once upon a time, we all learned that research process starts with brainstorming. However, at that very first moment when we start our first academic writing, we realize that in reality there are many “sunny days” prior to the “stormy days”. I am about to show you how “drawing guide” might be helpful in invoking “clouds” as a prerequisites for “storm”. Moreover, “drawing guide” might be very useful in further designing and structuring.
What is a “drawing guide”? It is a process similar to brainstorming, conducted through drawings. It is a personalized expression of thoughts through drawings. It is a technique that eventually helps to shape, concretize and embody our thoughts through words. Does it work? Yes, it does and I am going to describe my personal “drawing” experience. I have conducted a comprehensive study of Emir Kusturicaʼs film Underground – Once Upon a Time There Was a Country. It characterized a film representation of gender relations within the context of (self-)Balkanization; different types of “Balkan” masculinity and different “Balkan” gender relations at different levels in Kusturicaʼs film – on the first level, “love triangle” and on the second level, “lost triangle”. Although it might seem complexed at a first glance, it only took a few triangles.
Phase I: What
I went to the first meeting with my advisor and draw him this:
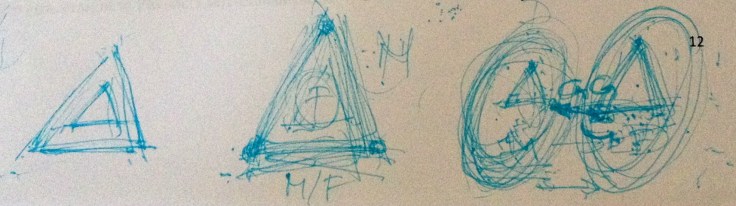
Advisor: What is that?
Sonja: Triangles.
Advisor: What do these triangles represent? And what are you going to do with these triangles?
Sonja: I do not know, but I am going to write my Master thesis based on these triangles.
Phase II: How
The following step was to bring triangles to life.
Main characters were recognized as “love triangle”, due to their interactions. In colloquial speech, the phrase that someone is in the “love triangle” is used to describe love relationship in which one of the partners cheats the other. By further observing their interactions, with other people who are not involved in their love story, few trends were noted. Actors in “love triangle” were powerful and dominant as a group, while their relatives were recognized as powerless and non-dominant group. In contrast to persons in “love triangle”, similar disabilities were recognized in characters of their relatives. By observing further interactions of relatives with outer world, the association was that they were “lost”. Therefore, group of their relatives was recognized as the “lost triangle”, which is diametrically opposite to the “love triangle”.

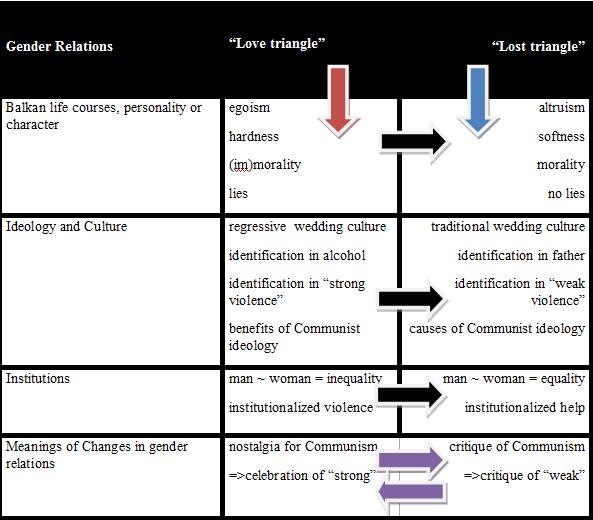
Based on these triangles I conducted the empirical analysis of gender relations at different generational (older brother-younger brother, father-son, older sister-younger brother) and socio-economic levels (Communism and Post-Communism), configured through the process of configuring practices (Connell). In a society, social practices are configured by individual life course, ideology and culture, and institutions.
Phase III: Revision
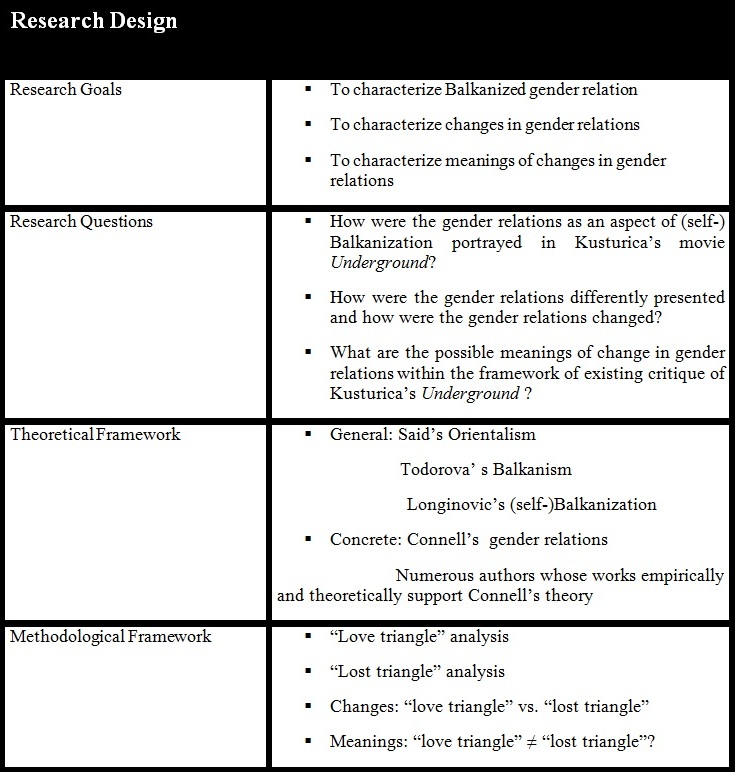
Namely, my draft versions of the research were always revised through “drawings”, by my advisor. One of the numerous “drawing revisions” evolved from “drawing” to the schematic overview of Research Design. The following illustration shows how “drawings” (by hand on the draft copies) eventually became the backbone of the structure of the work, and moreover were transferred into the Tables which are constitutive parts of it.

Phase IV: Outcome

After I had finished my empirical analysis with the table of schematic overview of outcomes, I realized that complete Master thesis was based on initial triangles that were drawn during the first talks with my advisor. That day I did not have a concrete idea nor a concrete direction for my research. However, I had a few “drawings” and I had an advisor who saw a potential as much as I did, even though it did not make much sense at the beginning.
I would like to emphasize the importance of these “drawings” in humanities, because it is often a case that some very promising ideas are still not “ripe” enough to be expressed in words. My advice is – draw your idea, it might fuel your writings. Moreover even in writings they could be very helpful in the further process of research designing and structuring.
Finally, “drawings” have a contribution other way around as well. If you can explain your work of hundreds or thousands of pages in a few “drawings”, your work will be interesting to a larger number of average readers, because visualization helps simplification of complex ideas. In other words… sorry, not in other words, wrong terminology… in other “drawings”, it could look like this:
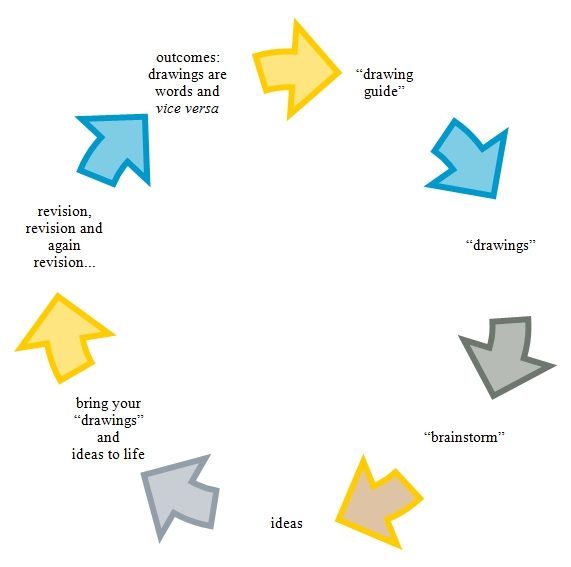
If I were to tell you that a single drawing could bring an idea to life, would you believe me? If not, bear in mind – A picture is worth a thousand words.
Citation
Stanisavljević, Sonja: “Drawing Guide”; in: Globalising Southeastern Europe (10.12.2015); URL: https://global-sees.org/2015/12/10/drawing-guide/.
